Ichimoku Kinko Hyo
Ichimoku Kinko Hyo (IKH) is an indicator that gauges future price momentum and determines future areas of support and resistance.
Now that’s 3-in-1 for y’all! Also, know that this indicator is mainly used on JPY pairs. So when CAN’T you use Ichimoku? When no clear trend exists. Basically, when the market is trading sideways, choppy, aka trendless. You’ll know it’s trendless when the price is oscillating on either side of the cloud.
Kijun Sen (blue line): Also called the standard line or baseline, this is calculated by averaging the highest high and the lowest low for the past 26 periods.
Tenkan Sen (red line): This is also known as the turning line and is derived by averaging the highest high and the lowest low for the past nine periods.
Chikou Span (green line): This is called the lagging line. It is today’s closing price plotted 26 periods behind.
Senkou Span (orange lines): The first Senkou line is calculated by averaging the Tenkan Sen and the Kijun Sen and plotting 26 periods ahead.
How to Trade Using Ichimoku Kinko Hyo
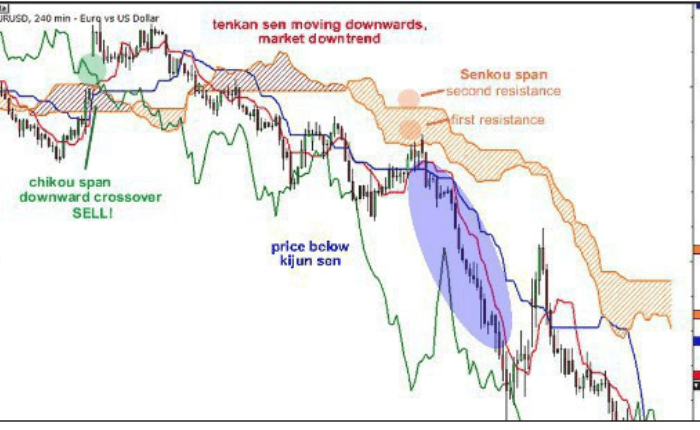
Senkou Let’s take a look at the Senkou span first. If the price is above the Senkou span, the top line serves as the first support level while the bottom line serves as the second support level. If the price is below the Senkou span, the bottom line forms the first resistance level while the top line is the second resistance level. Got it?
Kijun Sen Meanwhile, the Kijun Sen acts as an indicator of future price movement. If the price is higher than the blue line, it could continue to climb higher. If the price is below the blue line, it could keep dropping.
Tenkan Sen The Tenkan Sen is an indicator of the market trend. If the red line is moving up or down, it indicates that the market is trending. If it moves horizontally, it signals that the market is ranging.
Chikou Span Lastly, if the Chikou Span or the green line crosses the price in the bottom-up direction, that’s a buy signal. If the green line crosses the price from the top down, that’s a sell signal.