Technical analysis offers countless ways to study price action, but Harmonic Price Patterns stand out because they combine market structure with precise mathematical relationships. Rather than relying solely on visual chart formations, harmonic trading uses Fibonacci ratios to identify areas where price has a higher probability of reversing.
If you’ve ever noticed the market making seemingly random swings only to reverse at surprisingly precise levels, harmonic patterns help explain why. While no trading strategy guarantees success, these patterns provide traders with a structured framework for identifying potential turning points, planning entries, managing risk, and setting realistic profit targets.

Whether you trade forex, stocks, indices, commodities, or cryptocurrencies, understanding harmonic patterns can become a valuable addition to your technical analysis toolkit.
What Are Harmonic Price Patterns?
Harmonic Price Patterns are advanced chart patterns that use Fibonacci retracement and extension ratios to forecast potential market reversals. Unlike traditional chart patterns that focus mainly on shape, harmonic patterns require specific mathematical measurements between each price swing.
The theory behind harmonic trading is that financial markets often move in repeating cycles driven by crowd psychology. Those cycles frequently produce price swings that align closely with Fibonacci ratios, creating recognizable geometric formations.
A complete harmonic pattern consists of several connected price swings labeled X, A, B, C, and D. The final point, known as Point D, represents the Potential Reversal Zone (PRZ), where traders look for confirmation before entering a trade.
Rather than assuming every completed pattern will reverse, experienced traders wait for additional evidence such as candlestick confirmation, momentum shifts, or increased trading volume.
Why Fibonacci Ratios Matter
Understanding harmonic trading starts with understanding Fibonacci ratios because every pattern depends on these measurements.
The Fibonacci sequence produces ratios that appear surprisingly often in financial markets. Traders commonly use these percentages to estimate how far a market may retrace before continuing or reversing.
Some of the most important Fibonacci ratios include:
- 38.2%
- 50%
- 61.8%
- 78.6%
- 88.6%
- 127.2%
- 161.8%
- 224%
- 261.8%
Each harmonic pattern requires its own combination of retracements and extensions. If those measurements don’t align closely enough, the pattern is generally considered invalid.
This mathematical precision separates harmonic trading from subjective pattern recognition.
How Harmonic Price Patterns Work
Before examining individual patterns, it helps to understand the basic trading process.
A trader first identifies a sequence of price swings that resembles one of the known harmonic structures. They then measure each swing using Fibonacci tools to verify whether the required ratios match.
If the measurements align, the trader identifies the Potential Reversal Zone around Point D. Instead of immediately entering the trade, many traders wait for additional confirmation, such as:
- A bullish or bearish candlestick pattern
- Momentum indicators showing divergence
- Support or resistance holding
- Increased buying or selling pressure
This layered approach helps reduce false signals.
Main Components of a Harmonic Pattern
Every harmonic setup follows the same basic structure, even though each pattern uses different Fibonacci measurements.
XA Leg
The XA leg is the initial impulse move that establishes the overall direction of the pattern. Every later measurement is based on this first swing.
AB Leg
The AB leg retraces part of the XA move according to a specific Fibonacci percentage.
Different harmonic patterns require different retracement levels, making this one of the first validation steps.
BC Leg
The BC move retraces part of the AB leg while preparing for the final movement toward Point D.
Its size depends on which harmonic pattern is forming.
CD Leg
The CD leg completes the pattern and ends at the Potential Reversal Zone.
Many traders consider this the most important section because it identifies where the market may change direction.
Types of Harmonic Price Patterns
Several harmonic formations have become widely recognized among technical traders. Each has unique Fibonacci requirements and slightly different trading characteristics.
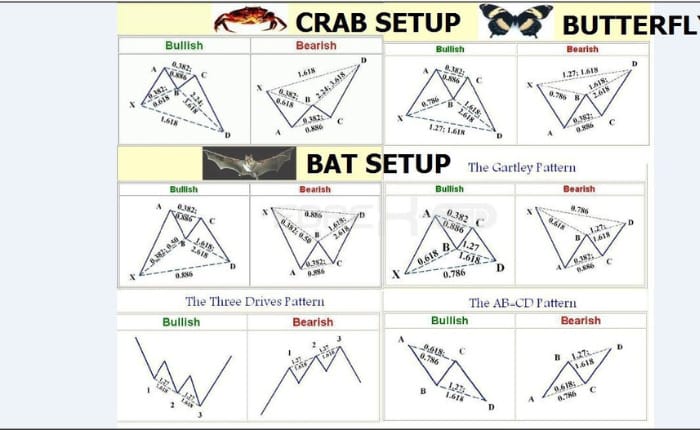
The Gartley Pattern
The Gartley Pattern is the most famous harmonic pattern and often serves as the introduction to harmonic trading.
The pattern resembles an “M” in bearish markets and a “W” in bullish markets. Its defining feature is that Point D typically completes near the 78.6% retracement of the XA leg.
A bullish Gartley suggests buyers may regain control after a corrective decline, while a bearish Gartley signals potential selling pressure after a rally.
Many traders appreciate the Gartley because it often forms in established trends rather than against them.
The Butterfly Pattern
The Butterfly Pattern extends beyond the starting point of the XA leg.
Unlike the Gartley, Point D usually finishes at a Fibonacci extension rather than a retracement, often around the 127.2% extension of XA.
Because the pattern stretches beyond previous highs or lows, it frequently captures market exhaustion before a reversal.
Butterfly patterns tend to appear near major market turning points.
The Bat Pattern
The Bat Pattern is known for producing relatively conservative entry opportunities.
Its Point D generally completes near the 88.6% retracement of the XA leg, creating a deeper correction than the Gartley.
Many swing traders prefer Bat patterns because the reversal zone is often well-defined, allowing tighter stop-loss placement.
The Crab Pattern
The Crab Pattern is one of the most aggressive harmonic formations.
Its defining characteristic is a very large extension of the XA leg, frequently reaching the 161.8% Fibonacci extension.
Although these setups may look dramatic, they can produce strong reversals when confirmed properly.
Since volatility is often elevated during Crab formations, careful risk management becomes especially important.
The Deep Crab Pattern
The Deep Crab shares similarities with the standard Crab but uses different Fibonacci retracement requirements.
It typically features a deeper retracement during the B point before extending aggressively toward Point D.
Because of its larger price swings, traders often wait for strong confirmation before entering.
The Shark Pattern
The Shark Pattern differs slightly from traditional XABCD structures.
Instead of ending with a classic Point D, it develops using alternative Fibonacci measurements and frequently transitions into another harmonic pattern after completion.
Some experienced harmonic traders use Shark patterns to identify early reversal opportunities before more recognizable formations appear.
The Cypher Pattern
The Cypher Pattern is one of the newer additions to harmonic trading.
Its Fibonacci requirements differ from the classic Gartley family, creating unique entry zones that many traders find easier to identify.
Although less common, the Cypher has gained popularity because its rules are relatively straightforward once understood.
Bullish vs Bearish Harmonic Patterns
The same harmonic structures can signal buying or selling opportunities depending on market direction.
Bullish harmonic patterns form after a decline. Traders anticipate that buyers may step in near the Potential Reversal Zone, leading to an upward move.
Bearish harmonic patterns develop after a rally. In this case, traders expect sellers to regain control and push prices lower.
The underlying mathematics remain identical. Only the market direction changes.
Advantages of Harmonic Price Patterns
Understanding both strengths and weaknesses helps traders use harmonic analysis realistically rather than expecting perfect results.
Some key advantages include:
- Objective Fibonacci measurements
- Clearly defined entry zones
- Logical stop-loss placement
- Favorable risk-to-reward opportunities
- Works across multiple financial markets
- Suitable for different timeframes
- Combines well with other technical indicators
Because the rules are specific, harmonic trading removes much of the subjectivity found in traditional chart pattern analysis.
Limitations of Harmonic Trading
Despite their precision, harmonic patterns are not perfect prediction tools.
Some common challenges include:
- Complex Fibonacci measurements
- Time-consuming pattern identification
- Frequent false patterns
- Confirmation is still necessary
- Beginners often mislabel patterns
- Market conditions can invalidate setups quickly
The biggest mistake new traders make is forcing patterns onto charts where they do not actually exist.
Quality matters far more than quantity.
How to Trade Harmonic Price Patterns
Knowing the pattern is only part of the process. A complete trading plan also includes confirmation, risk management, and exit strategies.
Step 1: Identify the Pattern
Look for clear XABCD price swings rather than trying to force a pattern.
Markets naturally create many zigzags, but only a small percentage meet harmonic requirements.
Step 2: Measure Fibonacci Ratios
Use your charting platform’s Fibonacci retracement and extension tools.
Verify that every leg closely matches the required measurements.
Step 3: Mark the Potential Reversal Zone
Point D becomes your area of interest rather than an automatic entry.
Think of it as a location where you expect the market to make a decision.
Step 4: Wait for Confirmation
Patience often separates experienced traders from beginners.
Confirmation might include:
- Engulfing candlestick patterns
- Pin bars
- Momentum divergence
- Trendline rejection
- Strong support or resistance
Waiting for confirmation reduces unnecessary trades.
Step 5: Manage Risk
Every trade should include a predetermined stop-loss.
Many harmonic traders place stops slightly beyond the Potential Reversal Zone to allow for normal market fluctuations.
Profit targets often use previous swing highs and lows or Fibonacci retracement levels.
Common Mistakes Traders Make
Many failed harmonic trades result from execution errors rather than flaws in the strategy itself.
Some of the most common mistakes include:
- Ignoring Fibonacci accuracy
- Trading incomplete patterns
- Entering before confirmation
- Using oversized positions
- Ignoring the broader market trend
- Moving stop-loss orders emotionally
- Expecting every pattern to succeed
Even high-quality harmonic setups experience losing trades. Consistent profitability comes from disciplined execution over many trades rather than relying on individual outcomes.
Best Indicators to Combine with Harmonic Patterns
Harmonic analysis becomes even stronger when combined with complementary technical tools.
Popular combinations include:
- Relative Strength Index (RSI) for momentum divergence
- MACD for trend confirmation
- Moving averages for overall trend direction
- Volume analysis
- Support and resistance zones
- Candlestick reversal patterns
Using multiple forms of confirmation increases confidence while helping filter lower-quality setups.
Which Markets Work Best for Harmonic Trading?
One reason harmonic trading remains popular is its flexibility.
The strategy can be applied to:
- Forex currency pairs
- Stock markets
- Cryptocurrency markets
- Commodities
- Indices
- Exchange-traded funds (ETFs)
It also works across various timeframes, from intraday charts to weekly and monthly charts. Higher timeframes generally produce stronger signals because they contain less market noise.
Are Harmonic Price Patterns Reliable?
Harmonic Price Patterns can be reliable when they are identified correctly and used alongside sound risk management. Their strength lies in providing objective entry and exit zones based on predefined Fibonacci relationships rather than subjective guesswork.
That said, they should never be treated as certainty. Financial markets are influenced by news events, economic data, liquidity, and trader sentiment, all of which can invalidate even textbook-perfect setups.
Many professional traders view harmonic patterns as probability tools rather than prediction tools. Combined with confirmation signals and disciplined position sizing, they can become a valuable part of a broader trading strategy.
Final Thoughts
Harmonic Price Patterns offer a structured and mathematically grounded approach to identifying potential market reversals. By combining chart structure with Fibonacci ratios, they help traders move beyond subjective analysis and focus on repeatable trading setups.
Learning harmonic trading takes practice. At first, identifying valid patterns can feel challenging, but experience improves recognition and accuracy over time. Rather than searching for every possible setup, focus on finding high-quality patterns that meet their Fibonacci requirements and align with the broader market context.
Used responsibly, harmonic analysis can complement trend analysis, support and resistance, momentum indicators, and disciplined risk management. While no strategy guarantees profitable trades, harmonic patterns provide traders with a logical framework for making more informed trading decisions across forex, stocks, cryptocurrencies, and other financial markets.
Trade Anytime, Anywhere with XM
Take your trading to the next level with a globally trusted forex and CFD broker. Enjoy competitive spreads, fast execution, and reliable customer support while trading securely.
With XM, you get access to powerful trading platforms, real-time charts, flexible account types, and advanced tools to help you analyze the markets and manage your trades efficiently. Start your journey today by opening a trading account for free and join millions of traders worldwide.
✅ Open an Account with XM
Our Editorial Desk – Focuses on forex trading, gold (XAU/USD), and commodities that move the markets. Our editorial desk blends human insight with AI-powered research to produce sharp, actionable content. We aim to help traders make informed decisions with unbiased market coverage.