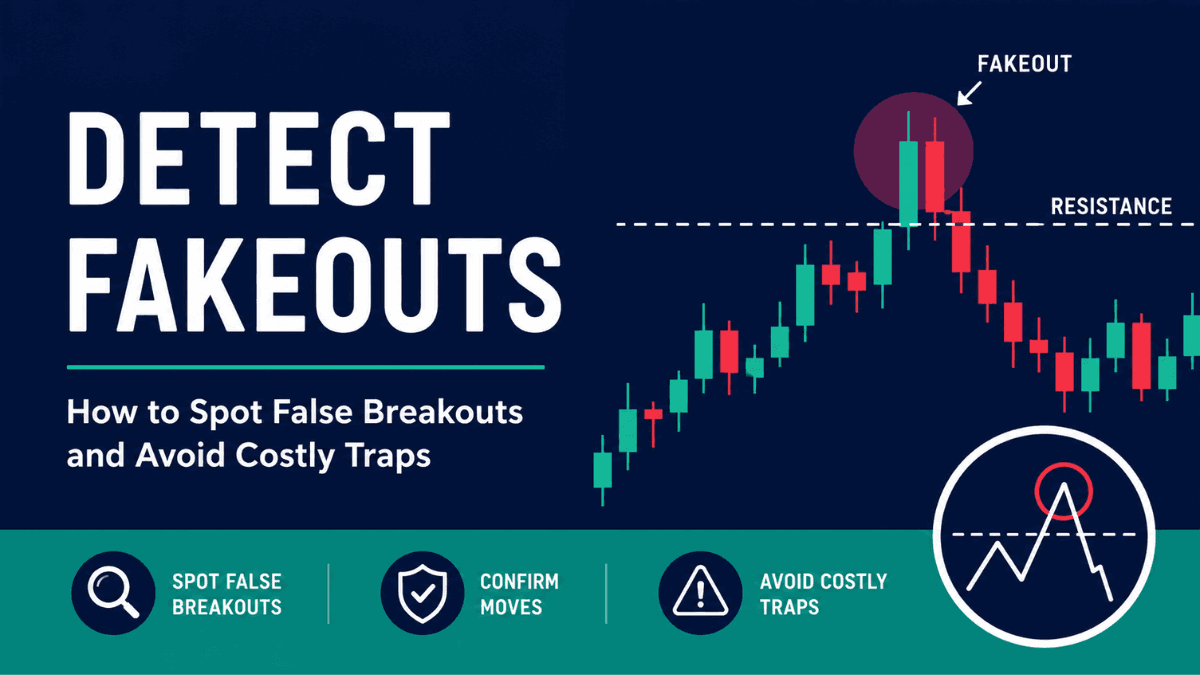
Every trader has experienced it. Price breaks above resistance or below support, you enter the trade expecting a strong move, and within minutes the market reverses, leaving you trapped in a losing position. Learning how to Detect Fakeouts is one of the most valuable skills you can develop because it helps you separate genuine opportunities from market traps.
A fakeout doesn’t just cost money—it can also damage your confidence and lead to emotional decision-making. The good news is that fakeouts leave clues before and after they happen. Once you understand how they work, you’ll become far more selective about the trades you take and significantly improve your decision-making.

This guide explains what fakeouts are, why they happen, how to identify them, and the practical techniques professional traders use to avoid falling into these common market traps.
What Is a Fakeout in Trading?
Before you can avoid fakeouts, you need to understand exactly what they are and why they occur.
A fakeout is a temporary price movement beyond an important support or resistance level that quickly reverses. Instead of continuing in the breakout direction, the market moves back inside the previous trading range.
Imagine a stock trading between $95 and $100 for several days. Price suddenly breaks above $100, encouraging traders to buy. Instead of continuing higher, buyers disappear, sellers step in, and the price falls back below $100. That breakout was a fakeout.
Fakeouts happen across every financial market, including:
- Forex
- Stocks
- Cryptocurrencies
- Commodities
- Indices
No market is immune because fakeouts are largely driven by trader psychology and liquidity.
Why Fakeouts Happen
Understanding the reasons behind fakeouts helps you recognize them before they become expensive mistakes.
Markets rarely move in straight lines. Large institutions often require significant liquidity to enter or exit positions, and breakout levels naturally attract many orders.
Common causes include:
Stop Hunting
Many traders place stop-loss orders just beyond obvious support or resistance levels.
Large market participants may push price slightly beyond these levels to trigger those stops. Once enough orders execute, price reverses sharply.
This process is often called a liquidity sweep because it provides the volume institutions need.
Emotional Retail Trading
Retail traders frequently enter immediately after seeing a breakout candle.
If enough buyers rush into a breakout without institutional support, the move can quickly lose momentum and reverse.
Low Trading Volume
Breakouts supported by weak trading volume often fail.
Without sufficient buying or selling pressure, price struggles to continue in the breakout direction.
News Volatility
Economic announcements and earnings reports can create sudden price spikes.
The initial reaction may appear convincing before the market settles and reverses once traders digest the news.
Why Learning to Detect Fakeouts Matters
Recognizing fakeouts isn’t just about avoiding losses. It also improves the quality of every trade you take.
When you learn to identify false breakouts, you can:
- Reduce unnecessary losing trades
- Improve your win rate
- Enter higher-probability setups
- Protect trading capital
- Build confidence through disciplined decision-making
Professional traders aren’t profitable because they predict every market move correctly. They’re profitable because they avoid many poor trades that inexperienced traders eagerly take.
How to Detect Fakeouts Before Entering a Trade
Several warning signs often appear before a fakeout develops. None of these indicators are perfect on their own, but combining them dramatically increases accuracy.
Wait for Candle Confirmation
The biggest mistake traders make is entering before the breakout candle has fully closed.
Markets frequently move beyond key levels during a candle before reversing before closing.
Waiting for the candle close confirms that buyers or sellers maintained control throughout the period.
Patience often saves more money than speed.
Watch Trading Volume
Volume measures how actively an asset is being traded.
Strong breakouts usually occur alongside increased volume because more participants support the move.
Weak volume suggests limited conviction, making the breakout more likely to fail.
Ask yourself:
“Is this breakout attracting new participants, or is price simply drifting beyond resistance?”
Look for Retests
Healthy breakouts often return to test the breakout level before continuing.
For example:
- Resistance becomes support after an upward breakout.
- Support becomes resistance after a downward breakout.
If the level successfully holds during the retest, the breakout becomes much more reliable.
Fakeouts often fail this test almost immediately.
Analyze Market Context
A breakout should fit within the broader market picture.
Suppose a currency pair is in a strong long-term downtrend.
A small breakout above resistance on a five-minute chart carries less weight because it goes against the dominant trend.
Trading with the larger trend reduces fakeout risk significantly.
Monitor Momentum Indicators
Momentum indicators help measure the strength behind price movements.
Popular examples include:
- Relative Strength Index (RSI)
- Moving Average Convergence Divergence (MACD)
- Stochastic Oscillator
If price breaks resistance while momentum weakens, buyers may already be losing strength.
Divergence between price and momentum frequently precedes fakeouts.
Observe Price Action
Price action refers to the movement of price itself without relying heavily on indicators.
Certain candlestick formations provide valuable clues.
Watch for:
- Long upper wicks after bullish breakouts
- Long lower wicks after bearish breakouts
- Doji candles showing indecision
- Engulfing reversal patterns
These formations often reveal hesitation or aggressive rejection.
Common Fakeout Patterns
Recognizing recurring chart behavior makes fakeouts easier to identify.
Break and Immediate Reversal
Price briefly breaks through support or resistance before quickly returning.
This is the most common fakeout pattern.
Bull Trap
A bull trap tricks buyers into entering long positions.
Price breaks above resistance, attracts buyers, then reverses sharply lower.
Late buyers become trapped as losses accumulate.
Bear Trap
A bear trap works in the opposite direction.
Price breaks below support, encouraging short selling.
Moments later, buyers regain control and push price sharply higher.
Short sellers are forced to cover their positions, accelerating the reversal.
Liquidity Sweep
Price deliberately moves beyond an obvious level where many stop-loss orders are clustered.
Once those stops trigger, institutions enter larger positions and reverse the market.
Liquidity sweeps occur regularly around major support, resistance, previous highs, and previous lows.
Indicators That Help Detect Fakeouts
Indicators should support price analysis rather than replace it.
Several tools consistently prove useful.
Volume Indicator
Volume confirms participation behind a breakout.
High volume generally strengthens breakout confidence.
Low volume raises caution.
Relative Strength Index (RSI)
RSI measures momentum.
If price reaches new highs while RSI fails to do the same, momentum may be weakening.
MACD
MACD helps identify trend strength and momentum shifts.
Weakening momentum near a breakout can warn of an approaching fakeout.
Average True Range (ATR)
ATR measures market volatility.
Very low volatility often produces unreliable breakouts because markets lack sufficient energy.
Risk Management When Trading Around Fakeouts
Even experienced traders cannot avoid every fakeout.
Risk management ensures that a single mistake never causes significant damage.
Use Stop-Loss Orders
A stop-loss automatically exits a trade if price reaches a predetermined level.
Place stops based on market structure rather than arbitrary distances.
Avoid placing stops exactly where everyone else does.
Reduce Position Size
Trading smaller positions reduces emotional pressure.
Smaller losses are easier to recover than oversized ones.
Never Chase Breakouts
If you missed the initial breakout, wait.
Markets continually create new opportunities.
Chasing price usually results in poor entries.
Risk Only a Small Percentage Per Trade
Many experienced traders risk only 1–2% of their account on each trade.
This approach allows them to survive inevitable losing streaks.
Practical Example of Detecting a Fakeout
Consider a stock that has repeatedly failed to move above $150.
One morning, it breaks to $151.
Many traders buy immediately.
Instead of entering, you wait for confirmation.
Volume remains average rather than increasing.
The breakout candle closes with a long upper wick.
Price quickly falls back below $150 during the next candle.
The breakout fails.
By waiting for confirmation instead of reacting emotionally, you avoided an unnecessary loss.
Mistakes Traders Make When Trying to Detect Fakeouts
Understanding common errors helps you avoid repeating them.
Frequent mistakes include:
- Entering before the breakout candle closes
- Ignoring volume confirmation
- Trading every breakout without context
- Forgetting the larger trend
- Placing stop-loss orders too close to obvious levels
- Allowing fear of missing out (FOMO) to drive decisions
- Depending on one indicator instead of combining multiple confirmations
Successful trading comes from stacking probabilities rather than searching for certainty.
Building a Fakeout Detection Checklist
Having a structured process removes emotion from trading decisions.
Before entering any breakout trade, ask yourself:
- Has the breakout candle closed?
- Is trading volume increasing?
- Does the breakout align with the higher timeframe trend?
- Has the breakout level been successfully retested?
- Are momentum indicators confirming the move?
- Is there nearby support or resistance that could stop the move?
- Does the risk-to-reward ratio justify the trade?
If several answers raise concerns, waiting is often the smartest decision.
Can Fakeouts Be Traded Profitably?
Interestingly, some experienced traders specialize in trading fakeouts rather than avoiding them.
Instead of buying breakouts, they wait for confirmation that the breakout has failed.
Once price returns inside the previous range, they trade in the opposite direction.
This strategy requires patience, excellent timing, and disciplined risk management. Beginners should first focus on recognizing fakeouts before attempting to trade them directly.
Final Thoughts
Learning to Detect Fakeouts is less about predicting the market and more about waiting for convincing evidence before committing your capital. Markets will always produce false breakouts, but disciplined traders don’t feel compelled to participate in every move.
The most reliable approach combines multiple forms of confirmation rather than relying on a single indicator. Watch how price behaves around key levels, pay attention to volume, consider the broader trend, and give the market time to reveal its intentions.
Over time, you’ll notice that avoiding poor trades often has a greater impact on your long-term performance than finding spectacular winning trades. Patience, confirmation, and disciplined risk management remain your strongest defenses against costly fakeouts.
Trade Anytime, Anywhere with XM
Take your trading to the next level with a globally trusted forex and CFD broker. Enjoy competitive spreads, fast execution, and reliable customer support while trading securely.
With XM, you get access to powerful trading platforms, real-time charts, flexible account types, and advanced tools to help you analyze the markets and manage your trades efficiently. Start your journey today by opening a trading account for free and join millions of traders worldwide.
✅ Open an Account with XM
Our Editorial Desk – Focuses on forex trading, gold (XAU/USD), and commodities that move the markets. Our editorial desk blends human insight with AI-powered research to produce sharp, actionable content. We aim to help traders make informed decisions with unbiased market coverage.