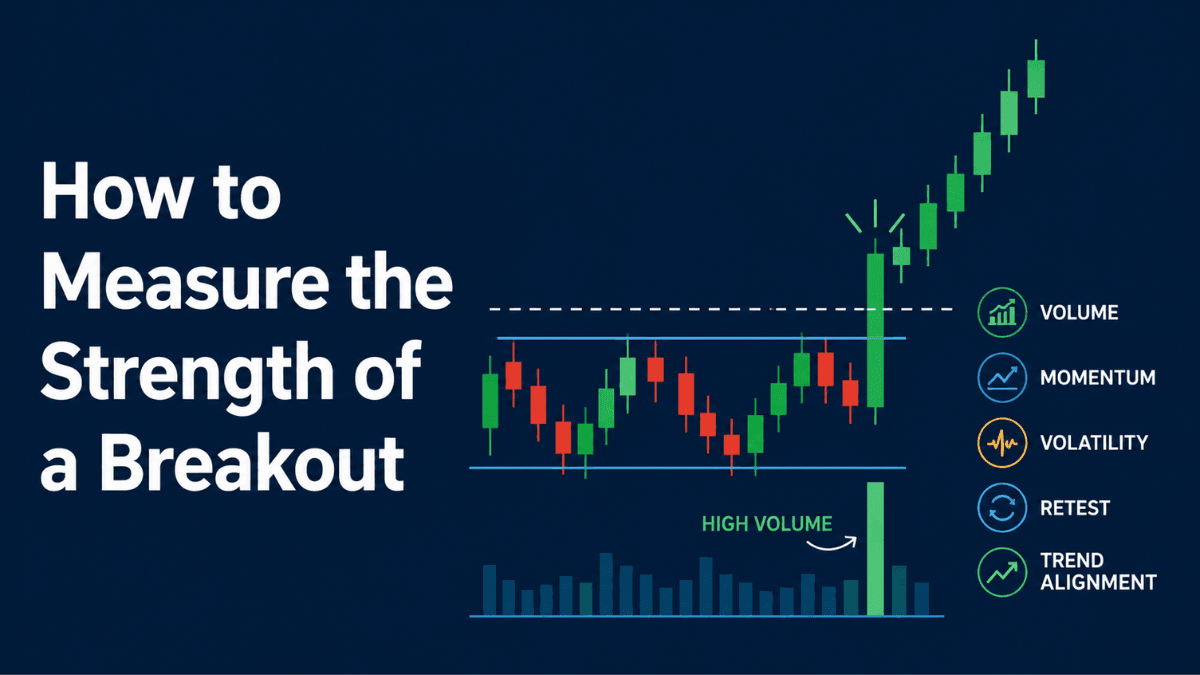
A breakout can signal the beginning of a powerful market move, but not every breakout deserves your attention. Learning how to measure the strength of a breakout helps you separate genuine trading opportunities from false moves that quickly reverse. Instead of entering every breakout you see, you can evaluate whether buyers or sellers truly have enough momentum to sustain the new trend.
Professional traders rarely rely on price alone. They examine volume, momentum, volatility, market structure, and confirmation signals before committing capital. When these factors align, the probability of a successful trade increases significantly.

This guide explains the most reliable ways to evaluate breakout strength, helping you make more informed trading decisions regardless of whether you trade stocks, forex, cryptocurrencies, or commodities.
Why Measuring Breakout Strength Matters
Every breakout begins with price moving beyond a significant support or resistance level. The challenge is determining whether the move represents genuine market conviction or simply a temporary price spike.
Strong breakouts often lead to extended trends, allowing traders to capture larger profits. Weak breakouts, on the other hand, frequently trap traders who enter too early before price reverses back into its previous range.
By evaluating breakout strength before entering a trade, you can:
- Reduce false breakout entries
- Improve trade timing
- Increase your reward-to-risk ratio
- Place stop-loss orders more effectively
- Build confidence in your trading decisions
Trading becomes less about guessing and more about interpreting objective market evidence.
What Makes a Breakout Strong?
A strong breakout reflects widespread agreement among market participants that price should move beyond its previous trading range. This usually happens after buyers or sellers gain overwhelming control.
Several characteristics commonly appear together:
- High trading volume
- Strong momentum
- Wide breakout candles
- Successful retests
- Increased volatility
- Alignment with the overall market trend
No single factor guarantees success. Instead, experienced traders evaluate multiple signals before concluding that a breakout has real strength.
How to Measure the Strength of a Breakout
Understanding breakout quality requires looking beyond price alone. The following methods provide a complete framework for evaluating whether a breakout is likely to continue.
Analyze Trading Volume
Volume measures how many shares, contracts, or units are traded during a specific period. It represents participation, making it one of the most important breakout indicators.
When price breaks above resistance with significantly higher-than-average volume, it suggests institutional investors and large traders are participating. Their involvement often creates sustained momentum.
Signs of strong volume include:
- Volume exceeding the recent average
- Consecutive high-volume breakout candles
- Increasing volume as price accelerates
- Continued strong volume after the breakout
If price breaks out on unusually low volume, the move deserves additional caution.
Evaluate the Size of the Breakout Candle
The breakout candle itself reveals valuable information about buying or selling pressure.
Strong breakout candles usually have:
- Large real bodies
- Small upper or lower wicks
- Close near the candle’s high (bullish)
- Close near the candle’s low (bearish)
These characteristics indicate that one side controlled trading throughout the session.
Small breakout candles with long wicks often signal uncertainty rather than conviction.
Check Momentum Indicators
Momentum indicators help determine whether price has enough strength to continue moving in the breakout direction.
Popular momentum indicators include:
- Relative Strength Index (RSI)
- Moving Average Convergence Divergence (MACD)
- Stochastic Oscillator
For example, a bullish breakout accompanied by rising RSI and a bullish MACD crossover provides stronger confirmation than price movement alone.
Remember that momentum supports price—it should not replace price action analysis.
Observe Volatility Expansion
Volatility refers to how much price fluctuates over time. Markets often alternate between periods of low volatility and high volatility.
Many strong breakouts occur after prolonged periods of low volatility. Once price escapes the range, volatility expands rapidly as traders react.
Indicators such as the Average True Range (ATR) or Bollinger Bands can help identify volatility expansion.
A breakout accompanied by increasing ATR or expanding Bollinger Bands often has greater potential to continue.
Watch for a Successful Retest
Many of the strongest breakouts revisit the broken level before continuing.
For example, after price breaks above resistance, that previous resistance often becomes new support. If buyers successfully defend the level during the retest, confidence in the breakout increases.
Successful retests typically feature:
- Lower trading volume during the pullback
- Bullish reversal candles
- Quick rejection of lower prices
- Resumption of upward momentum
Not every breakout retests immediately, but when it does, the retest provides valuable confirmation.
Measure the Distance from Key Resistance or Support
The further price moves beyond the breakout level while maintaining momentum, the stronger the breakout generally becomes.
Tiny moves beyond resistance can simply represent market noise.
Meaningful breakouts usually establish clear separation between the old range and current price.
This separation shows that buyers or sellers have maintained control rather than allowing price to drift back into consolidation.
Consider the Higher Time Frame
A breakout on a five-minute chart may look impressive until you examine the daily chart.
Always compare your trading timeframe with a higher timeframe.
For example:
- A daily breakout carries more significance than a five-minute breakout.
- A weekly breakout often signals major institutional participation.
- Multiple timeframe confirmation strengthens confidence.
Professional traders frequently begin analysis from higher timeframes before refining entries on lower charts.
Confirm Trend Alignment
Breakouts that occur in the direction of the prevailing trend generally have higher probabilities of success.
Suppose a stock has been making higher highs and higher lows for several months. A breakout above recent resistance fits the existing trend and often attracts additional buyers.
Countertrend breakouts require stronger confirmation because they challenge the broader market direction.
Trend alignment reduces the odds of trading against institutional momentum.
Look for Market Participation
Strong breakouts rarely occur in isolation.
Ask yourself:
- Is the overall market moving in the same direction?
- Is the sector showing strength?
- Are similar assets breaking out simultaneously?
For example, if several technology stocks break above resistance while the technology sector index also rallies, the breakout gains additional credibility.
Broader market participation often supports sustained price movement.
Monitor Follow-Through After the Breakout
The first breakout candle tells only part of the story.
The following sessions often determine whether buyers or sellers maintain control.
Healthy follow-through typically includes:
- Higher highs after the breakout
- Higher lows in bullish markets
- Continued buying volume
- Limited selling pressure
When price immediately stalls or reverses, the breakout may have lacked genuine strength.
Common Signs of a Weak Breakout
Recognizing weak breakouts can save you from unnecessary losses.
Warning signs include:
- Low trading volume
- Long candle wicks
- Immediate reversal
- Failure to hold above resistance
- Weak momentum readings
- Divergence between price and momentum indicators
- Breakout against the larger trend
The presence of one warning sign does not automatically invalidate the trade, but multiple warning signs should encourage greater caution.
Practical Example of Measuring Breakout Strength
Imagine a stock has traded between $48 and $50 for three weeks.
One morning, price breaks above $50 with trading volume nearly twice the daily average. The breakout candle closes near its high, while RSI rises above 60 and ATR begins increasing.
The following day, price briefly returns to test $50 before buyers quickly step in, pushing the stock toward $53.
Several positive factors align:
- Strong volume
- Bullish momentum
- Volatility expansion
- Successful retest
- Continued follow-through
This combination suggests the breakout has a much higher probability of continuing than a breakout based solely on price crossing resistance.
Mistakes Traders Make When Evaluating Breakouts
Many breakout failures stem from rushing into trades before sufficient confirmation appears.
Common mistakes include:
- Buying immediately after any breakout candle
- Ignoring trading volume
- Trading against the higher timeframe trend
- Overlooking false breakout patterns
- Entering after an excessively extended move
- Placing stop-loss orders too close to the breakout level
- Relying on a single indicator
Successful traders evaluate the complete market picture rather than depending on one signal.
Tips for Improving Breakout Analysis
Building consistency takes practice and disciplined observation.
Consider adopting these habits:
- Wait for candle closes rather than reacting mid-candle.
- Combine price action with volume confirmation.
- Analyze multiple timeframes before entering.
- Keep a trading journal documenting successful and failed breakouts.
- Test your breakout strategy on historical charts before risking real capital.
- Avoid chasing breakouts that have already moved significantly beyond the entry point.
These habits can improve decision-making while reducing emotional trading.
Frequently Asked Questions
What is the strongest confirmation of a breakout?
There is no single confirmation signal, but a breakout supported by high volume, strong momentum, volatility expansion, and follow-through is generally considered the most reliable.
Is volume always necessary for a strong breakout?
Volume is one of the most important confirmation tools, particularly in stocks and futures. In forex, where centralized volume is unavailable, traders often rely on tick volume alongside price action and momentum indicators.
Should I wait for a breakout retest?
Waiting for a retest often reduces the risk of entering false breakouts. However, some of the strongest breakouts never return to test the breakout level, so waiting may occasionally result in missed opportunities.
Which timeframe produces the most reliable breakouts?
Higher timeframes such as the daily and weekly charts generally produce more reliable breakouts because they reflect broader market participation and reduce short-term market noise.
Can indicators predict breakout strength?
Indicators cannot predict the future with certainty. They help confirm whether price action is supported by momentum, volatility, and participation, improving the quality of your trading decisions.
Final Thoughts
Knowing how to measure the strength of a breakout can dramatically improve your trading results. Rather than reacting to every price movement, you learn to evaluate the quality behind the move using objective evidence such as volume, momentum, volatility, market structure, and follow-through.
No breakout is guaranteed to succeed, and false breakouts remain part of every market. The goal is not perfection but increasing the probability that each trade is supported by multiple confirming factors. With patience, disciplined analysis, and consistent practice, you’ll become better at distinguishing high-quality breakout opportunities from temporary market noise.
Trade Anytime, Anywhere with XM
Take your trading to the next level with a globally trusted forex and CFD broker. Enjoy competitive spreads, fast execution, and reliable customer support while trading securely.
With XM, you get access to powerful trading platforms, real-time charts, flexible account types, and advanced tools to help you analyze the markets and manage your trades efficiently. Start your journey today by opening a trading account for free and join millions of traders worldwide.
✅ Open an Account with XM
Our Editorial Desk – Focuses on forex trading, gold (XAU/USD), and commodities that move the markets. Our editorial desk blends human insight with AI-powered research to produce sharp, actionable content. We aim to help traders make informed decisions with unbiased market coverage.